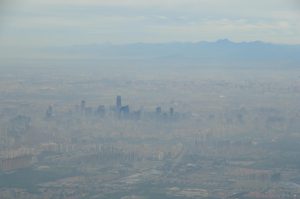
The Great Wall may not, after all, be visible from space – but Chinese air pollution is.
A team of researchers at Battelle Memorial Institute and Columbia University, in collaboration with Yale University, recently used satellite readings to produce data on fine particulate concentrations in Chinese provinces. While these satellite measurements are not perfect, they provide the first estimates of ground-level annual average concentrations of the pollutant PM 2.5 for all of China over the last decade.
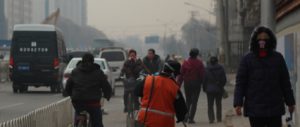
PM 2.5 is the term for particulate matter measuring 2.5 microns or less in diameter and has become a focus of public safety campaigners in China in recent months. Fine particulates have the ability to penetrate human lung and blood tissue and can lead to asthma, cardiovascular disease and cancer.
How are the satellite measures of PM 2.5 derived? In short, scientific instruments aboard the satellites assess something called Aerosol Optical Depth (AOD). This is a measure of the degree to which aerosol particles prevent the transmission of light either through absorption or scattering.
Several studies have developed algorithms and models to relate the AOD measures to ground-based measurements of particulate matter. Of course, relating these atmospheric column measurements to ground-level measurements is tricky and depends on the vertical structure, composition, size, distribution and water content of the atmospheric aerosol. Therefore, regional differences and climatology also play a role in the extrapolation of PM 2.5. (The methods used to extrapolate PM 2.5 measurements are described in full here.)
The PM 2.5 concentrations are expressed in terms of average exposure by province or municipality. The population-weighted exposure for a specific province is calculated by multiplying the satellite-estimated PM 2.5 concentration for each grid cell by the percentage of the province population that lives within that grid cell and producing an average for all of the grid cells within a province.
This means that PM2.5 concentrations for more heavily populated areas within a province will count more towards the provincial average than the outlying or sparsely populated areas. This standard approach addresses the cases where, for example, there is relatively clean air over a large percentage of a province, but nobody lives there to be “exposed”, while a large proportion of the population lives in a small area with high PM 2.5 concentrations (or vice versa).
As a result, the population-weighted numbers are more telling of actual exposure to fine particulate matter. Simply put, these numbers represent an average air quality situation an average citizen in the Chinese province in question would face on any given day.
What do the measurements show?
The figures provided below reveal telling trends for PM 2.5 data in China. All but four provinces (excluding Taiwan) have average annual exposures to PM 2.5 above levels recommended by the World Health Organization (WHO). Figure 1, below, shows a map of population-weighted fine particulate matter concentrations in China’s 31 provinces in 2007. Most provinces exceed the WHO recommendation for PM 2.5 levels, which is set at an annual average of 10 micrograms per cubic metre.
Figure 1. Annual-average population-weighted fine particulate matter concentrations (PM 2.5) for Chinese provinces, including Taiwan, in 2007.
The time series data provided in Figure 2 and Figure 3 offers an insight into PM 2.5 trends in different Chinese provinces. PM 2.5 concentrations are the highest in Shandong and Henan provinces. Beijing, Shanghai and Guangdong province have experienced slight decreases in annual average PM 2.5 levels over the last three years, although concentrations have remained fairly steady over the last nine years. Unsurprisingly, less developed western provinces such as Tibet and Inner Mongolia have the lowest fine particulate matter concentrations.
Figure 2. Nine-year time trend of average annual PM 2.5 concentration data for selected provinces and municipalities in China.
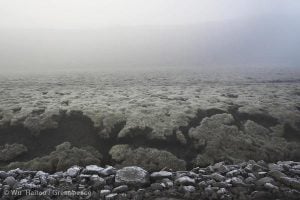
Of course, as with any type of modeling, there is an associated uncertainty. In particular, satellites aren’t as good at reading AOD over bright surfaces such as snow and deserts, and they also can’t tell you about vertical distribution of particles in the atmosphere (for example, they can’t distinguish particles high up or close to the surface). The uncertainty with the model we used is about +/- 25 percent, which translates into 6.7 micrograms per cubic metre.
Satellite measurements do not ultimately match up to data from earth: ground-based, in-situ measurements are ideal. However, satellite air-quality measurements can help to fill in spatial and information gaps where ground-based monitoring stations are not available. Furthermore, satellite measures provide consistent, repeated monitoring that allow for comparison over time and between areas. As Chinese policymakers face up to PM 2.5, data from space can help them understand what they are dealing with.
Figure 3. Nine-year time trend of average annual PM 2.5 concentration data for provinces and municipalities in China, including Taiwan. (Click to enlarge the image)
Angel Hsu is a doctoral student at the Yale School of Forestry and Environmental Studies and project director for the 2012 Environmental Performance Index. Map produced with funding from the NASA Earth Science Division Applied Sciences Program, by scientists at Battelle Memorial Institute with the guidance of CIESIN at Columbia University and YCELP at Yale University.
Homepage image provided by SeaWiFS Project, NASA/Goddard Space Flight Center, and ORBIMAGE