Climate

India Meteorological Department illustrates rain crisis

The divergences between normal rainfall and abnormal rainfall during the Indian monsoon, as illustrated by the India Meteorological Department, are so large as to change the meaning of "normal"
<p>Women work in paddy fields in Assam after monsoon flood waters. Image source: Diganta Talukdar</p>

Women work in paddy fields in Assam after monsoon flood waters. Image source: Diganta Talukdar

India is now experiencing the tail end of a monsoon that has seen both severe water scarcity and massive floods. While the fluctuation in rainfall brought on by climate change has been an issue for some years now, recent data on this year’s monsoon released by the India Meteorological Department paints a striking portrait of how wide these divergences are.

The chart showing rainfall on September 4, 2019 in various states, compared to the amount of rainfall through the time period June 1 – September 4, is of special note. On that day Chandigarh received 19.6 mm of rain when the average amount would have been 0.9 mm. This was an excess percentage of 2,072%. What is most striking is not just this huge variation, but that the overall rainfall Chandigarh received from June 1 to September 4 was 595.9 mm, or 18% less than the average amount of 722.6 mm.

Image from Indian Meteorological department

This is classified as “normal” by the IMD which means a fluctuation of 19% over or under the average. But, with the large variations on specific days, the monsoon would have been anything but “normal” for those that experienced it.

With this basis we can look at the wider spread of how the states experienced rainfall. Across all the districts in India (683 in total), 298 or 44% received “normal rainfall”. The next largest number of districts 220, or 32% of the total, received deficient rainfall, classified as 20%-59% less than normal. 114 (17%) received excess rainfall (20%-59% higher than average), 28 (4%) received large excess rainfall (60% or more than average), and 18 (3%) districts received large deficient rainfall (60%-99% less than the usual).

These are such large divergences from “normal” that the very idea of what the monsoon is, is being called into question.

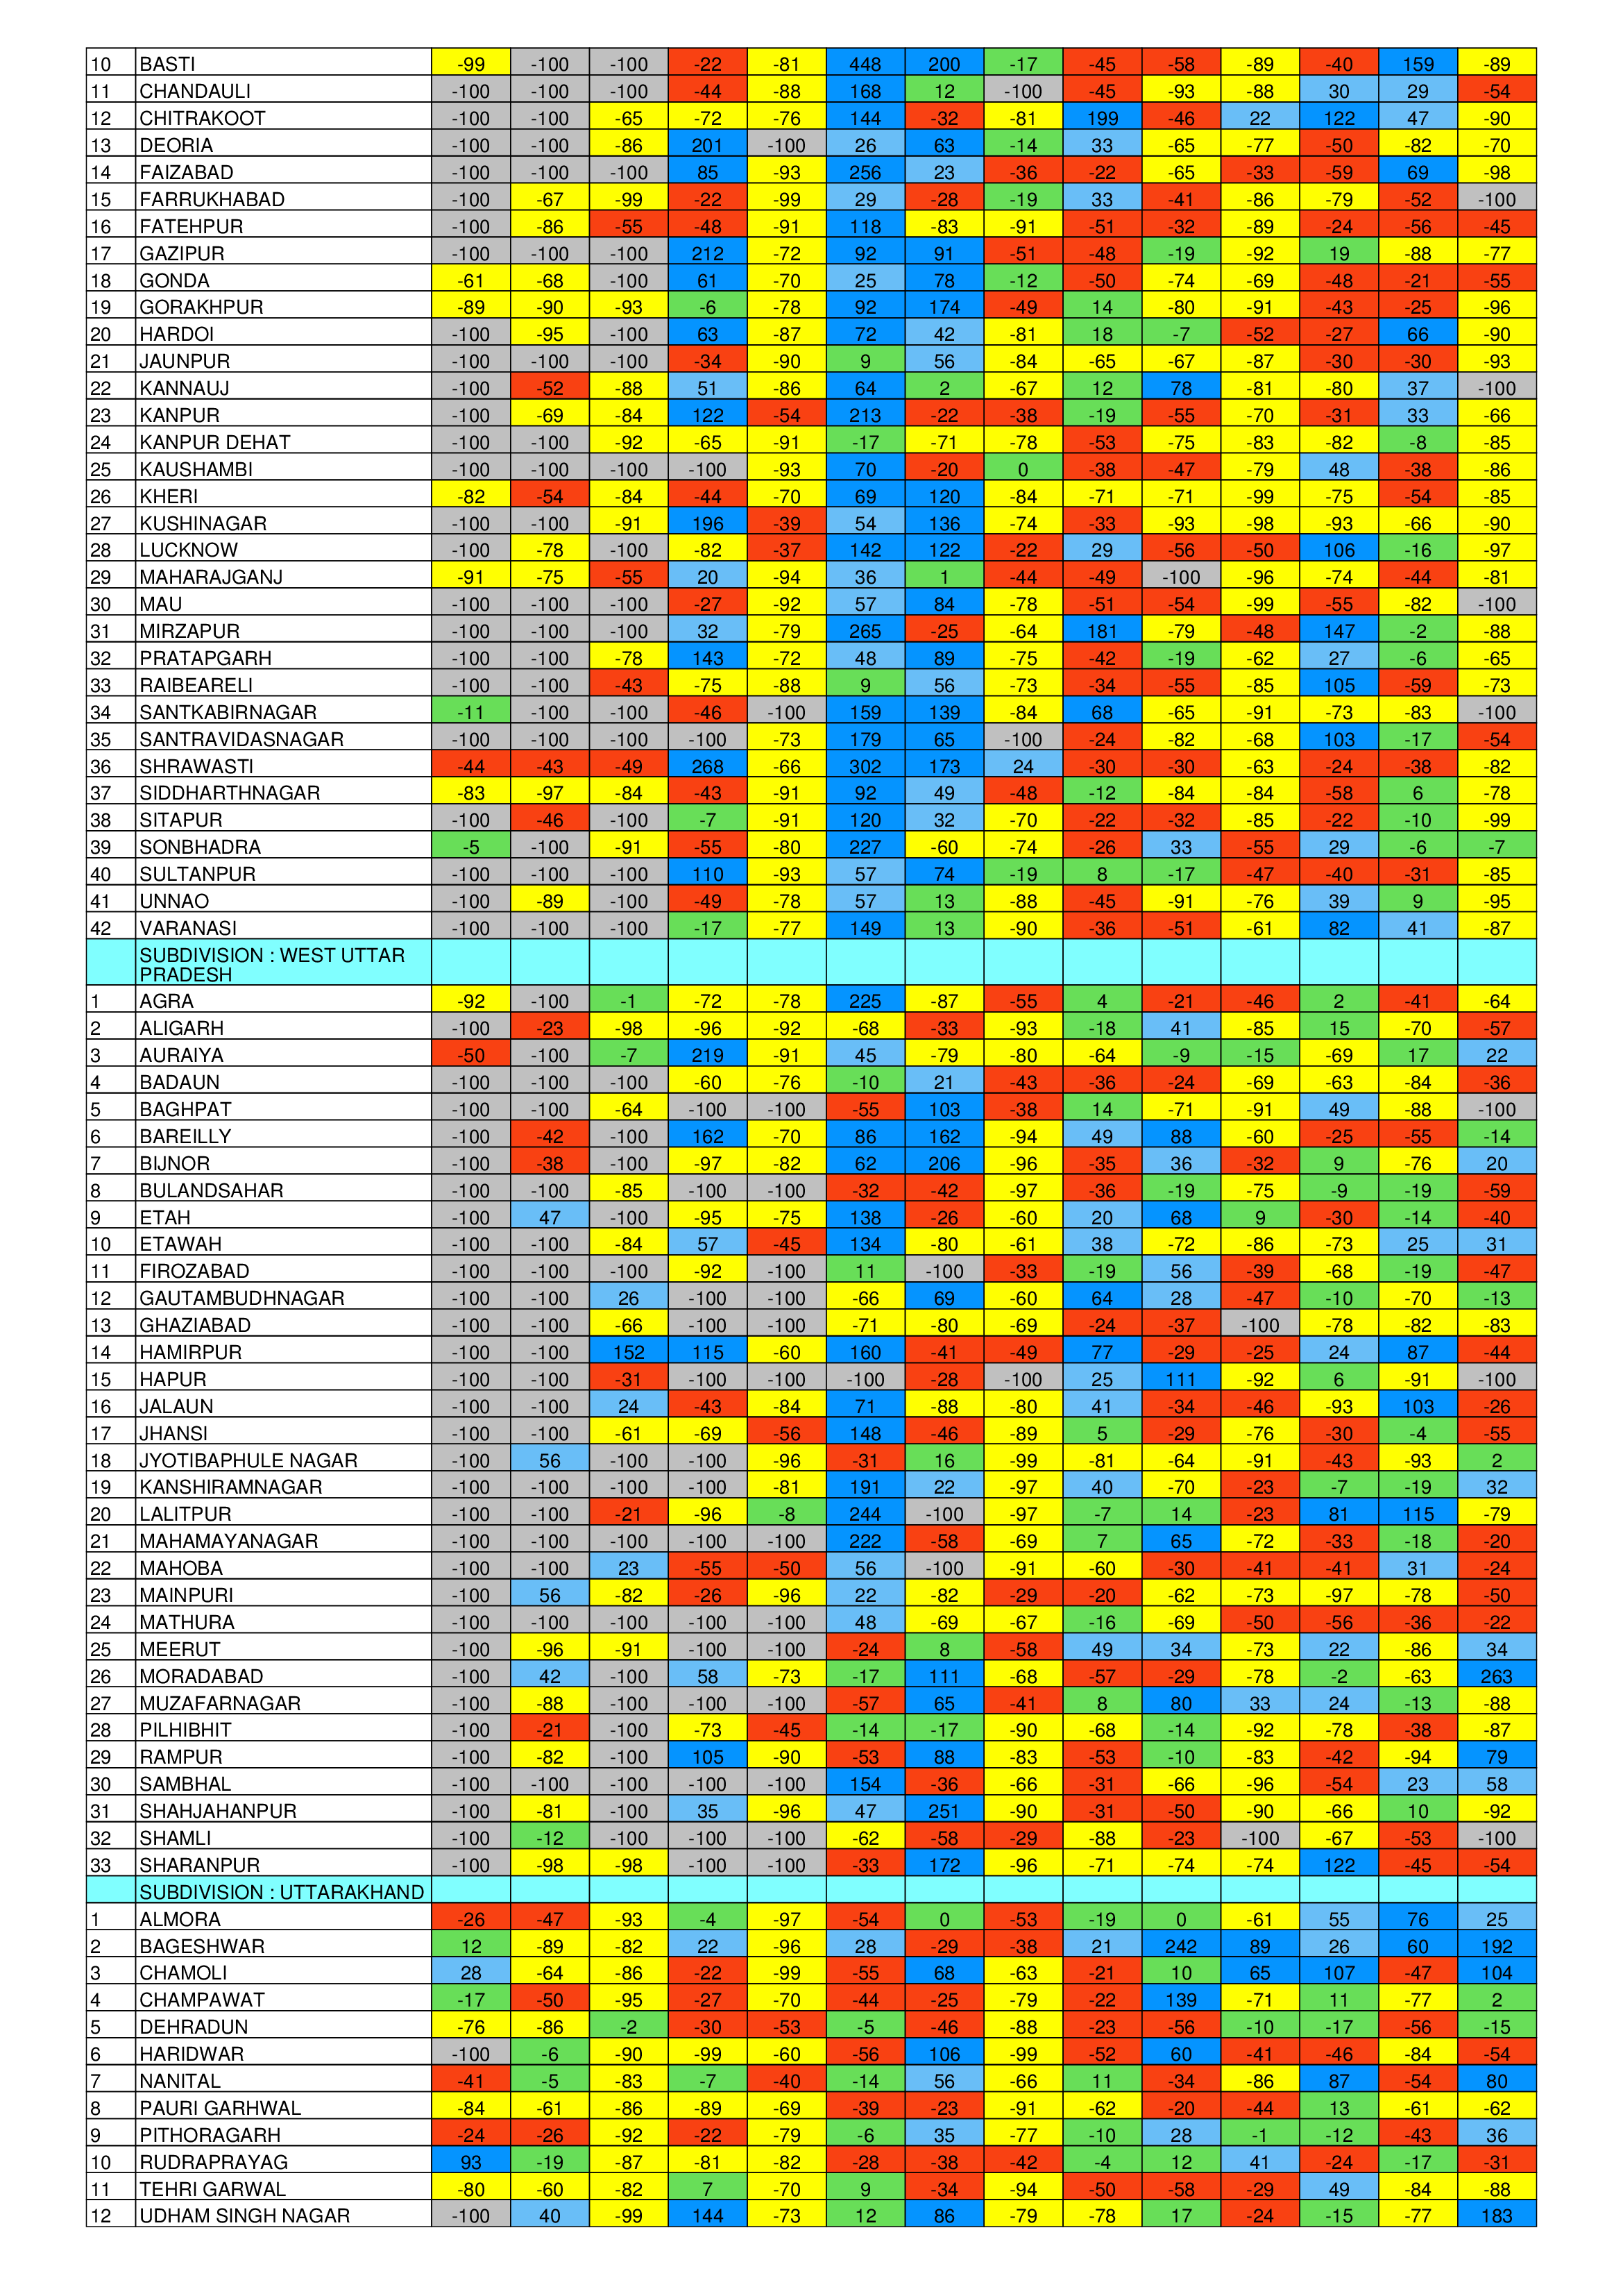
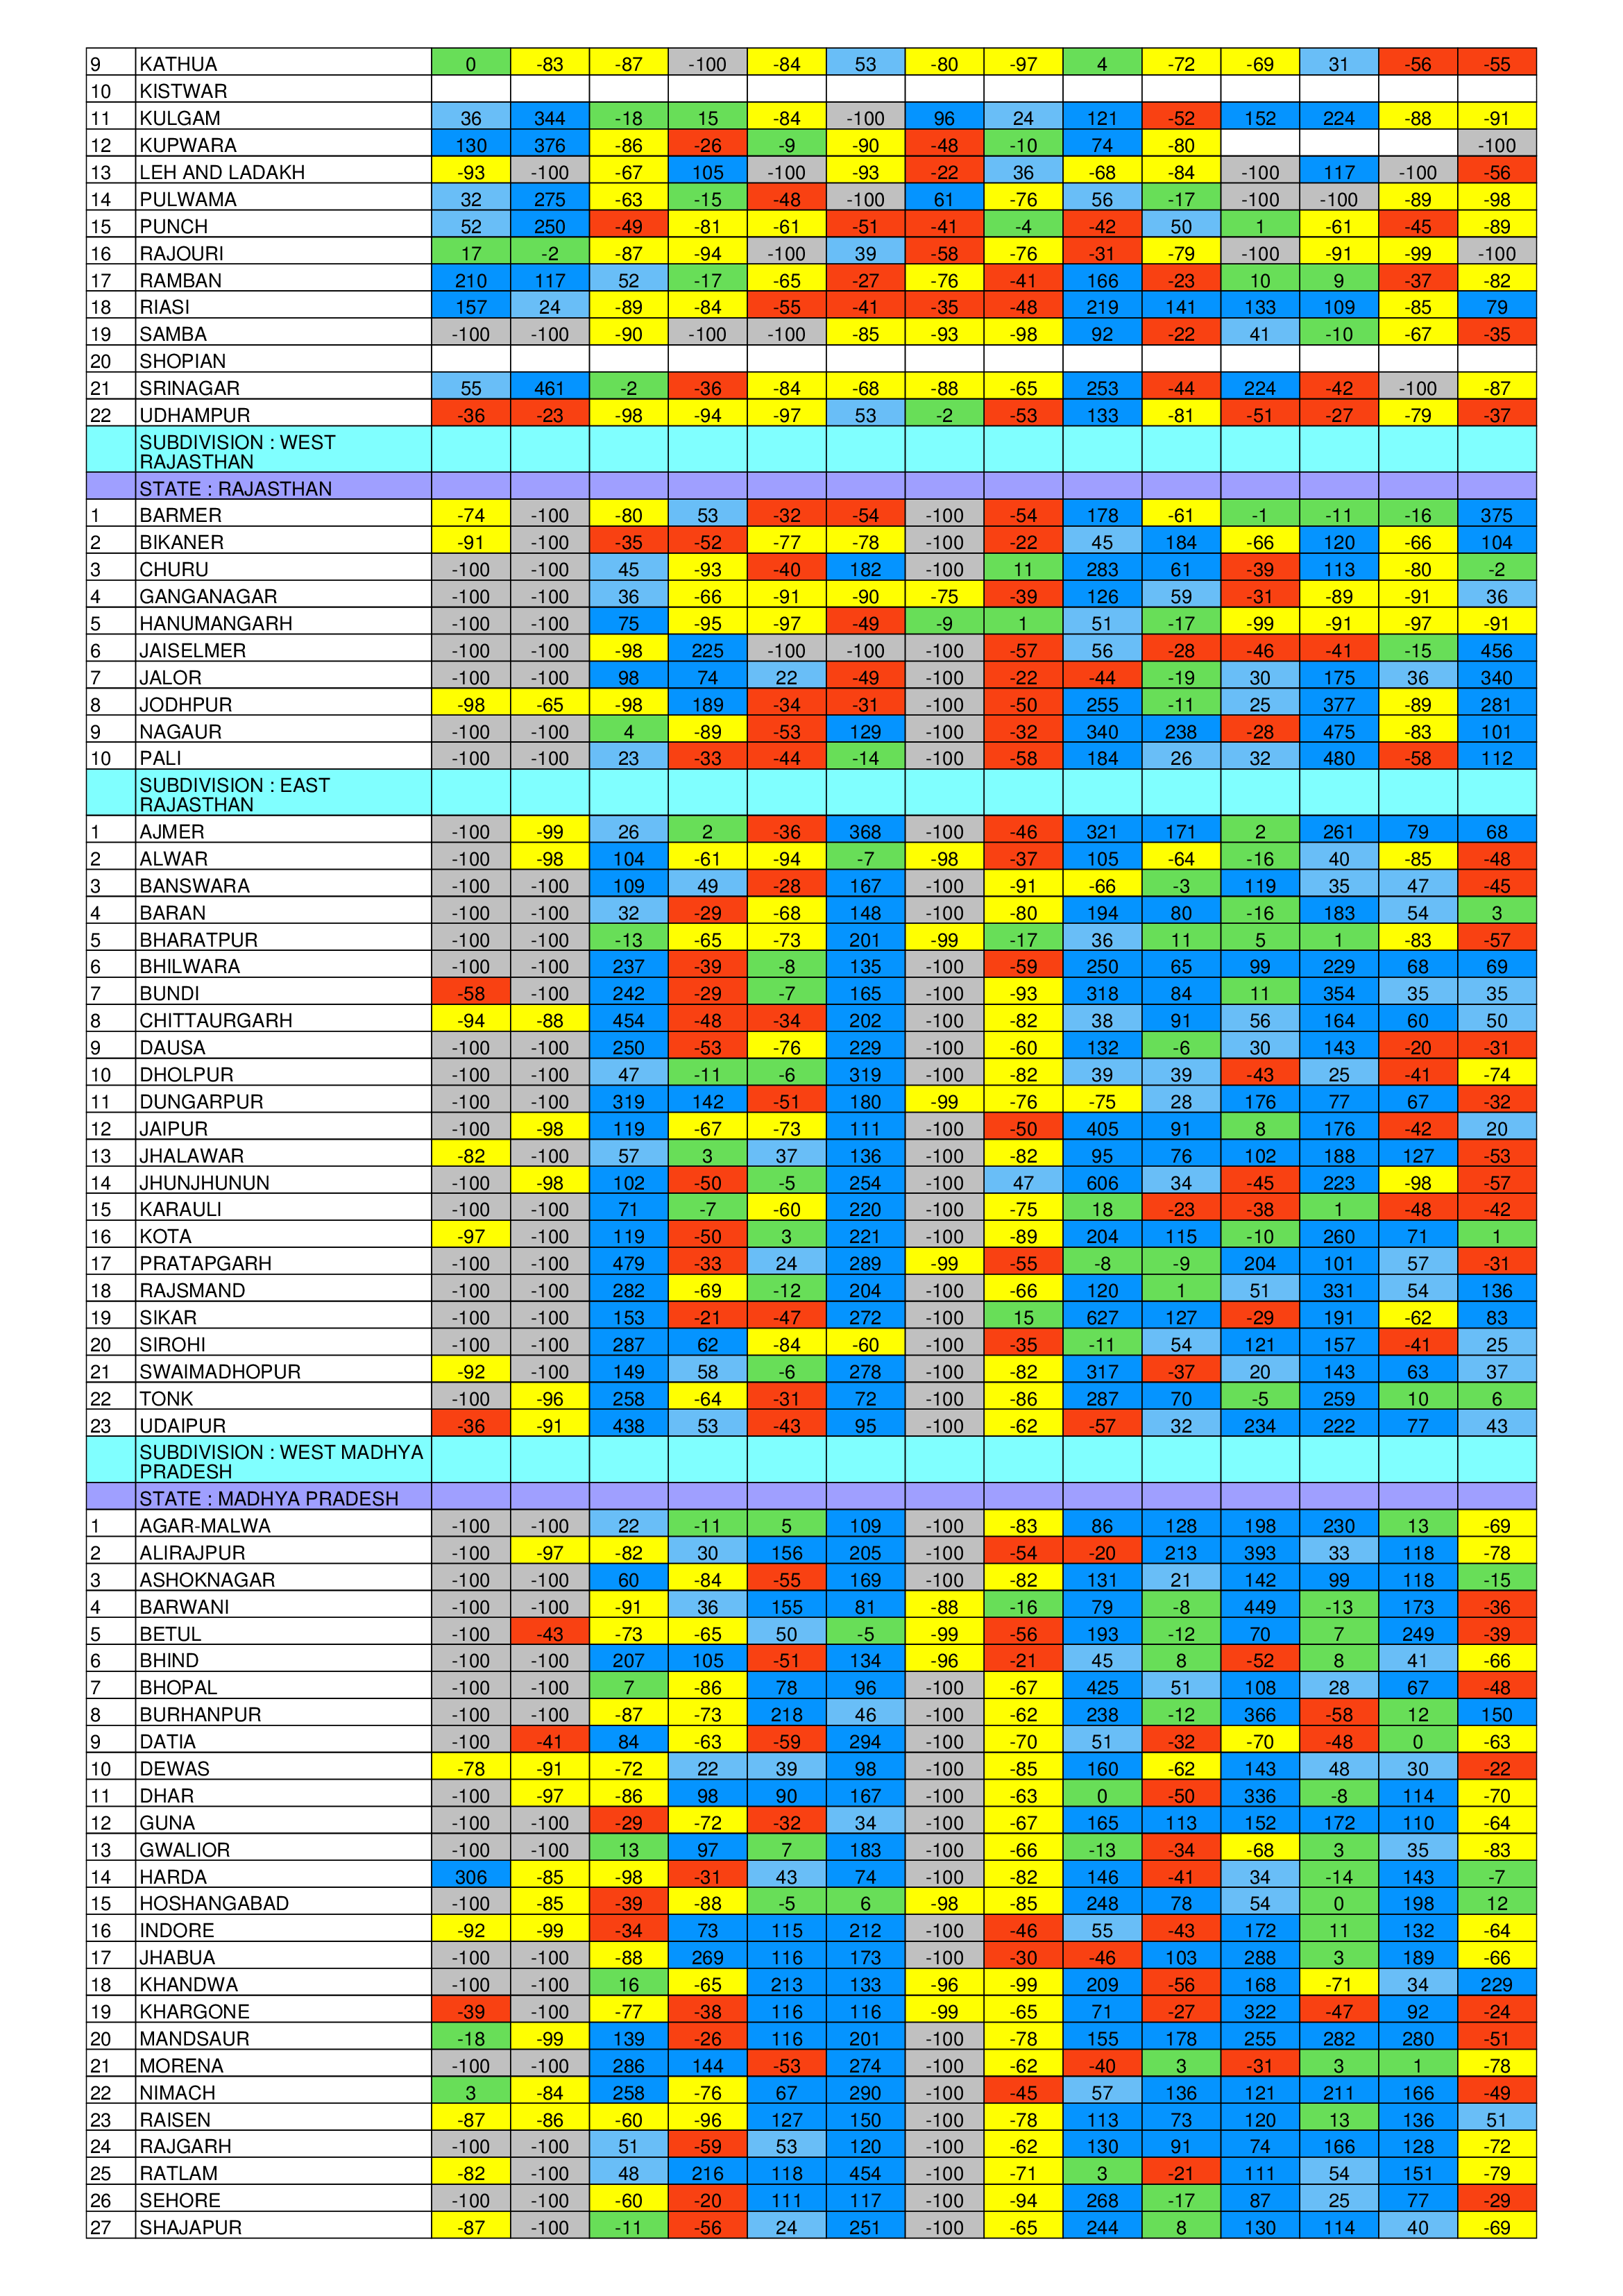
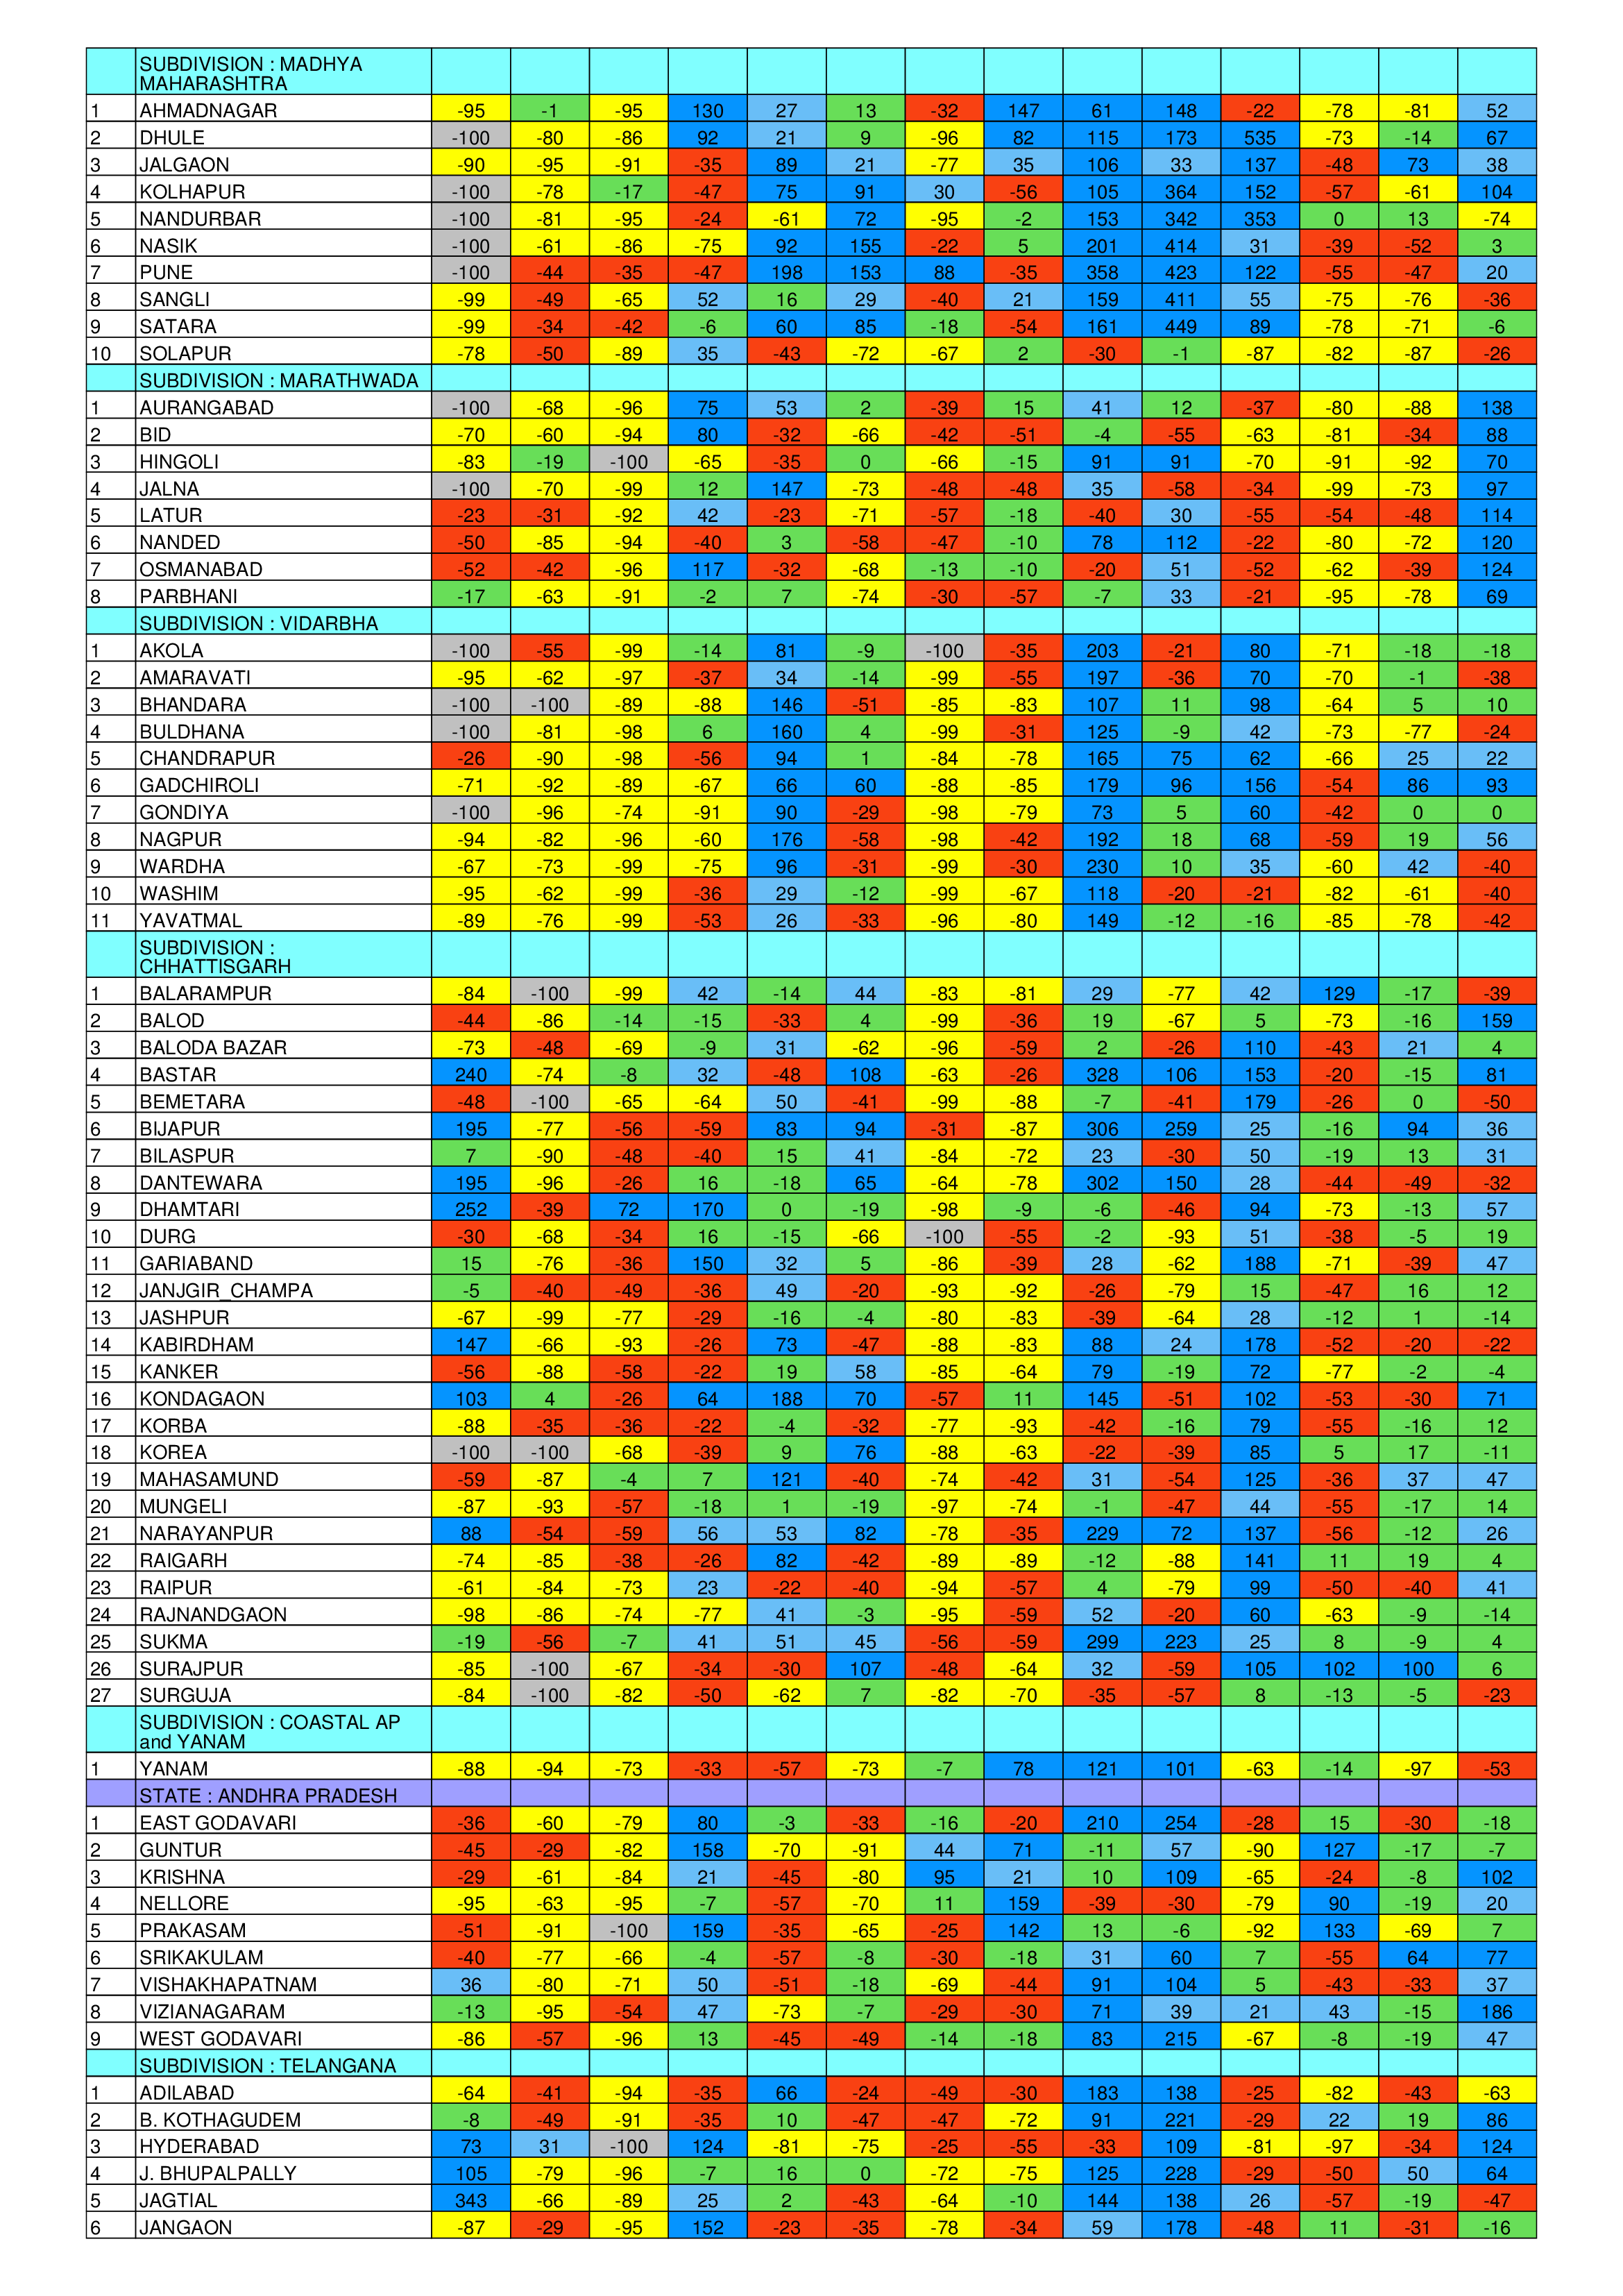
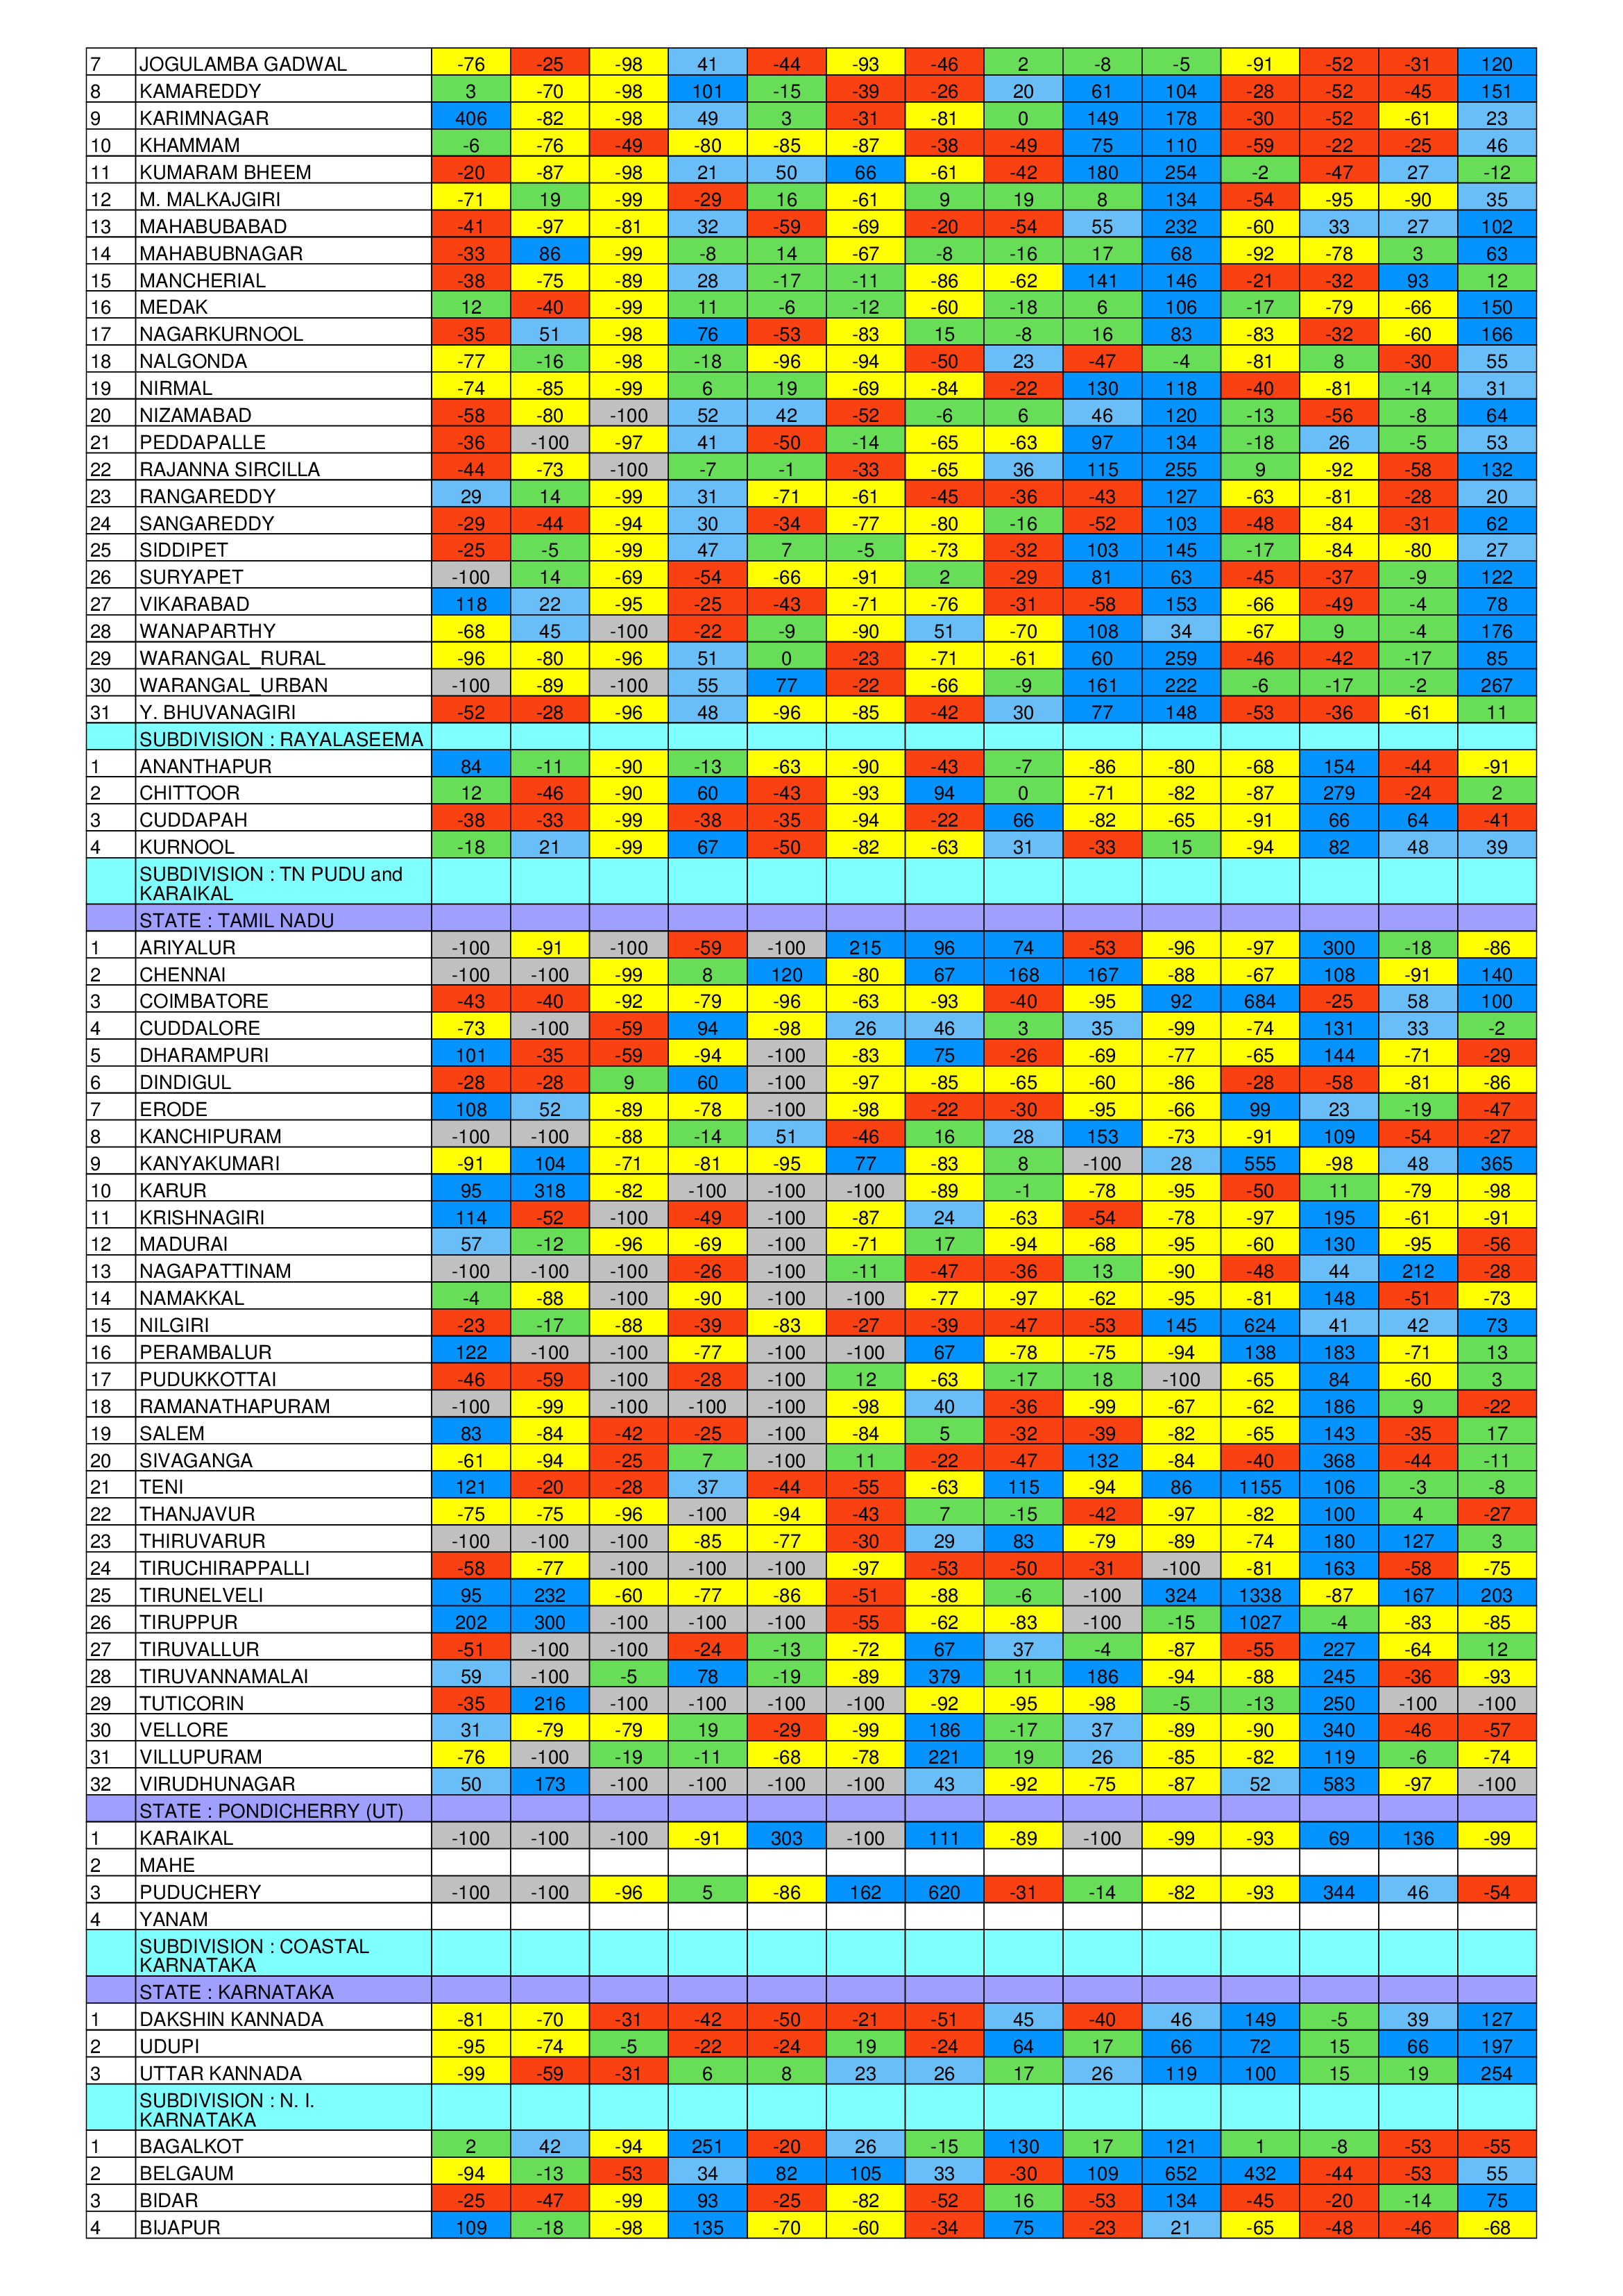
Maybe the most important picture comes from a week by week breakdown of rainfall divergences across all districts. Bear in mind the green squares are of normal rainfall (-19% to 19% extra). This is the crisis that Indian farmers, many of them reliant on rainfed agriculture, find themselves faced with.

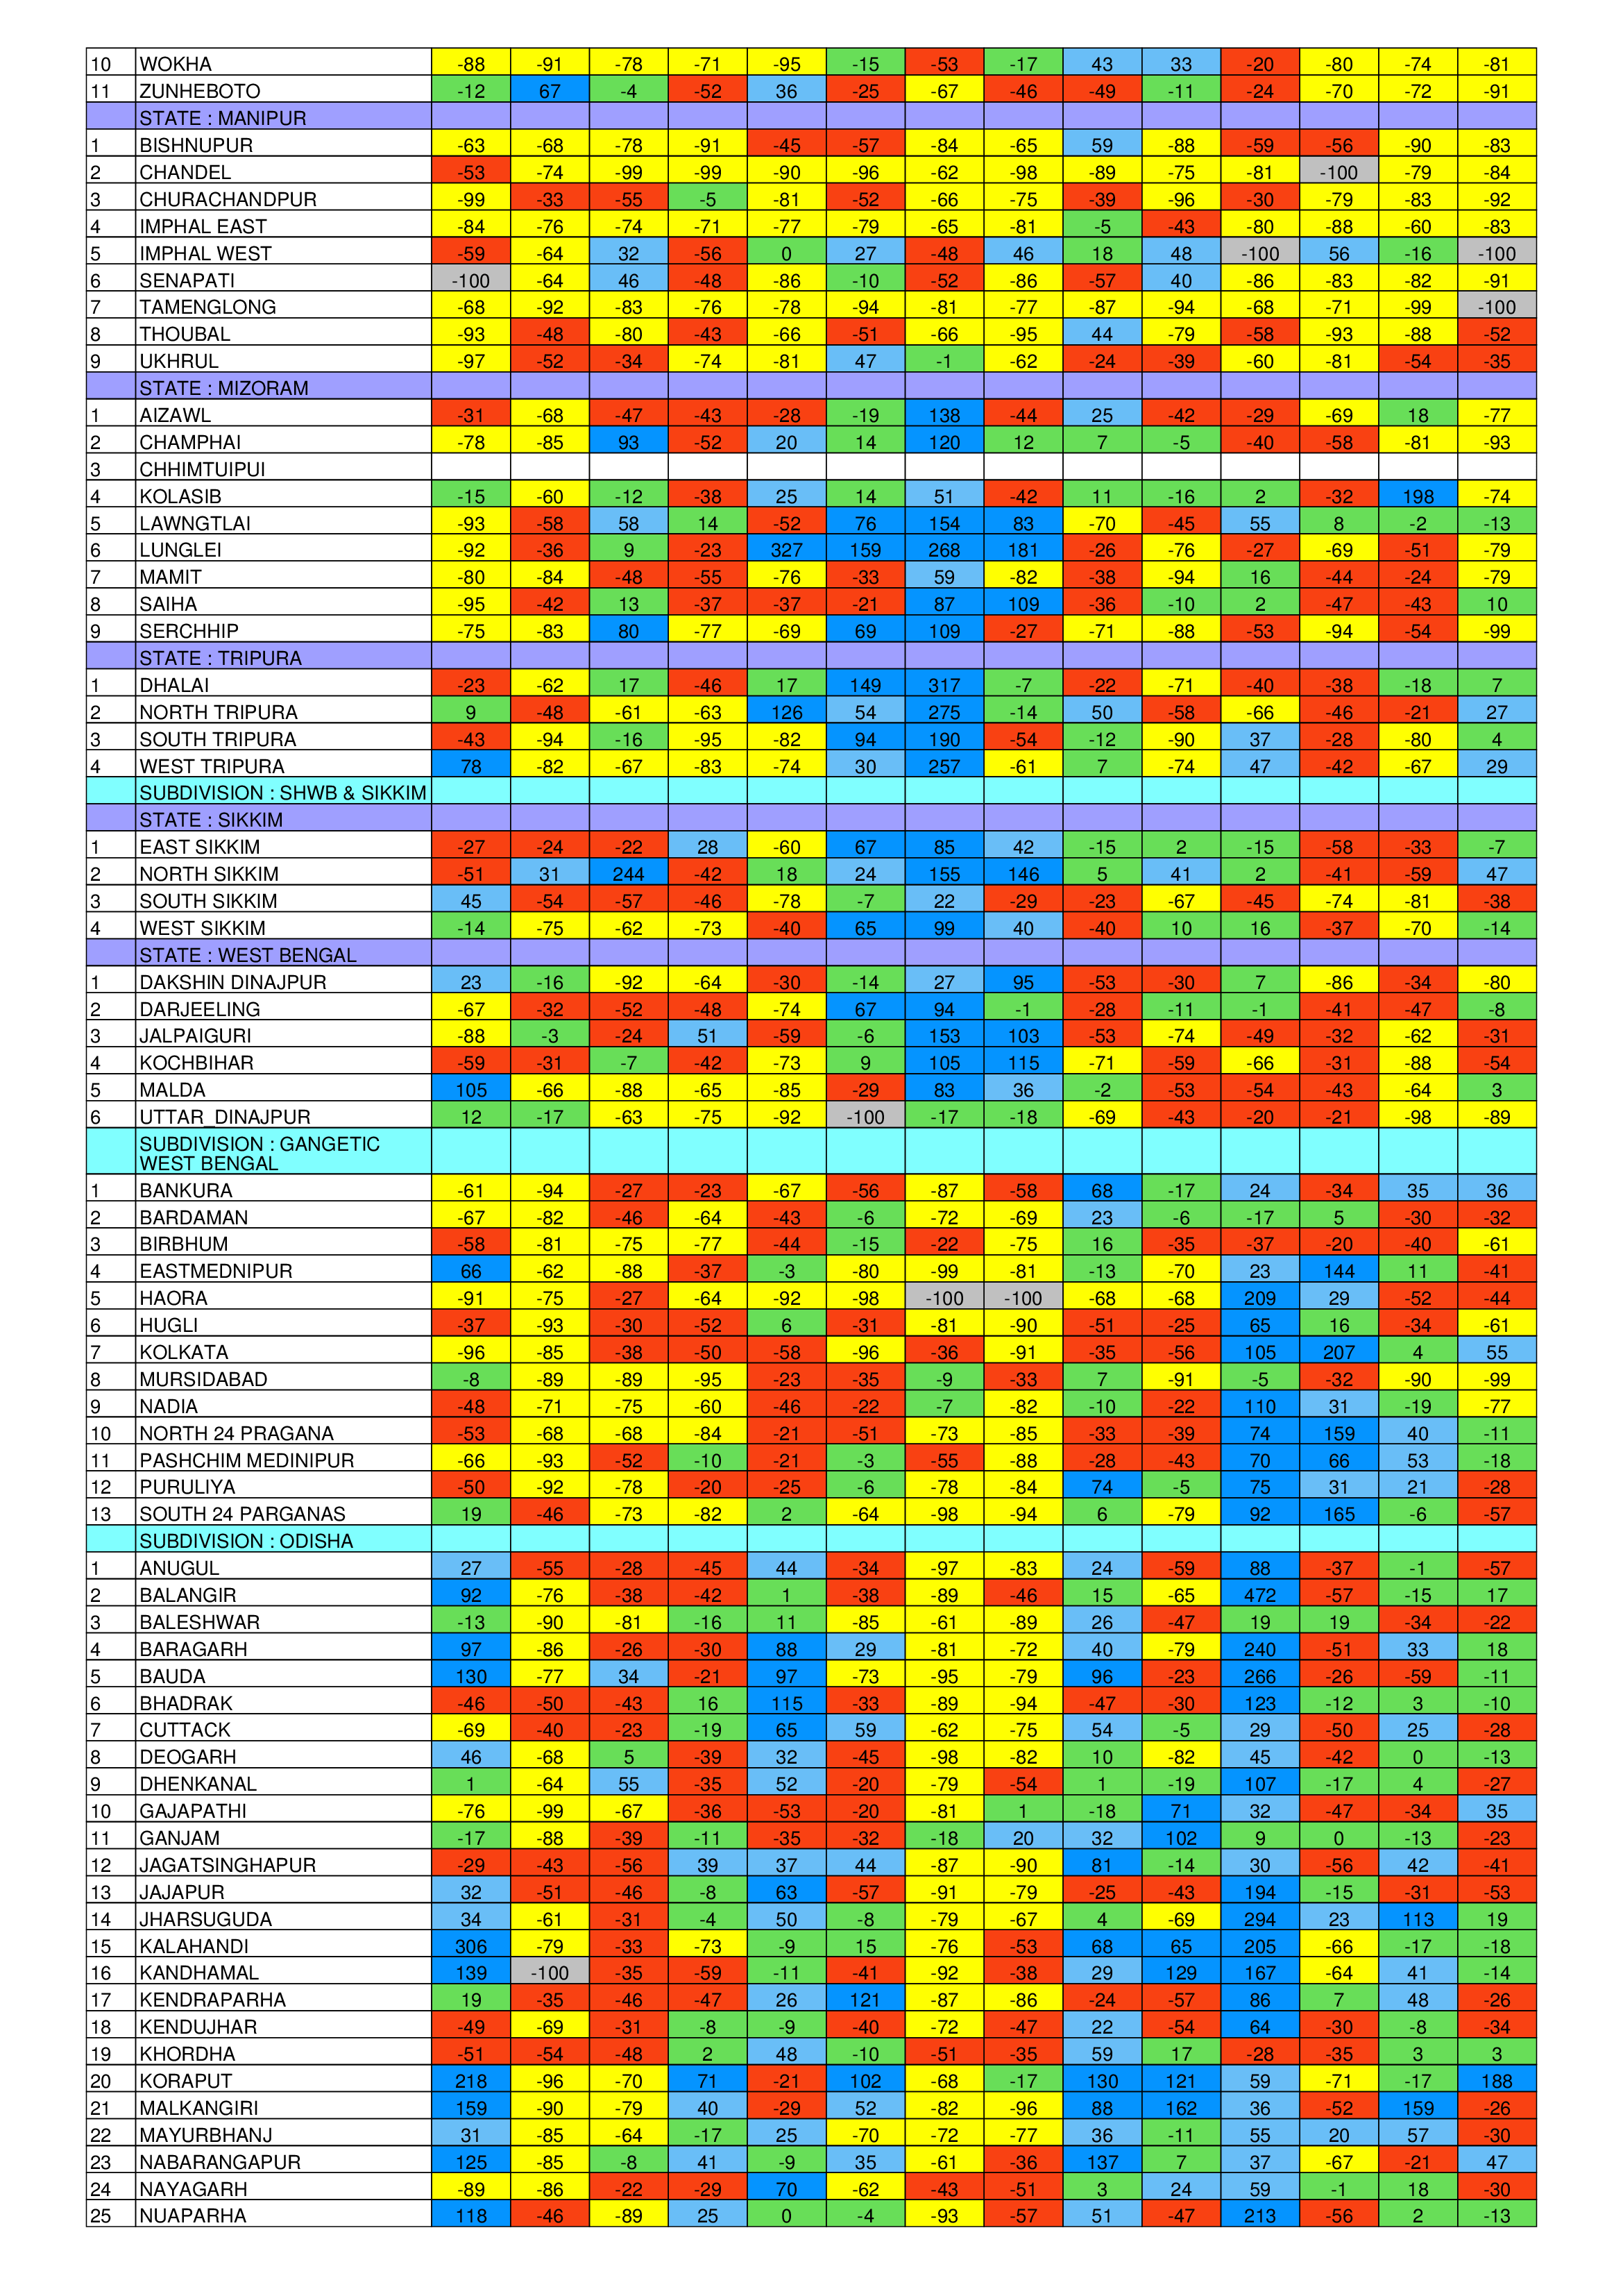
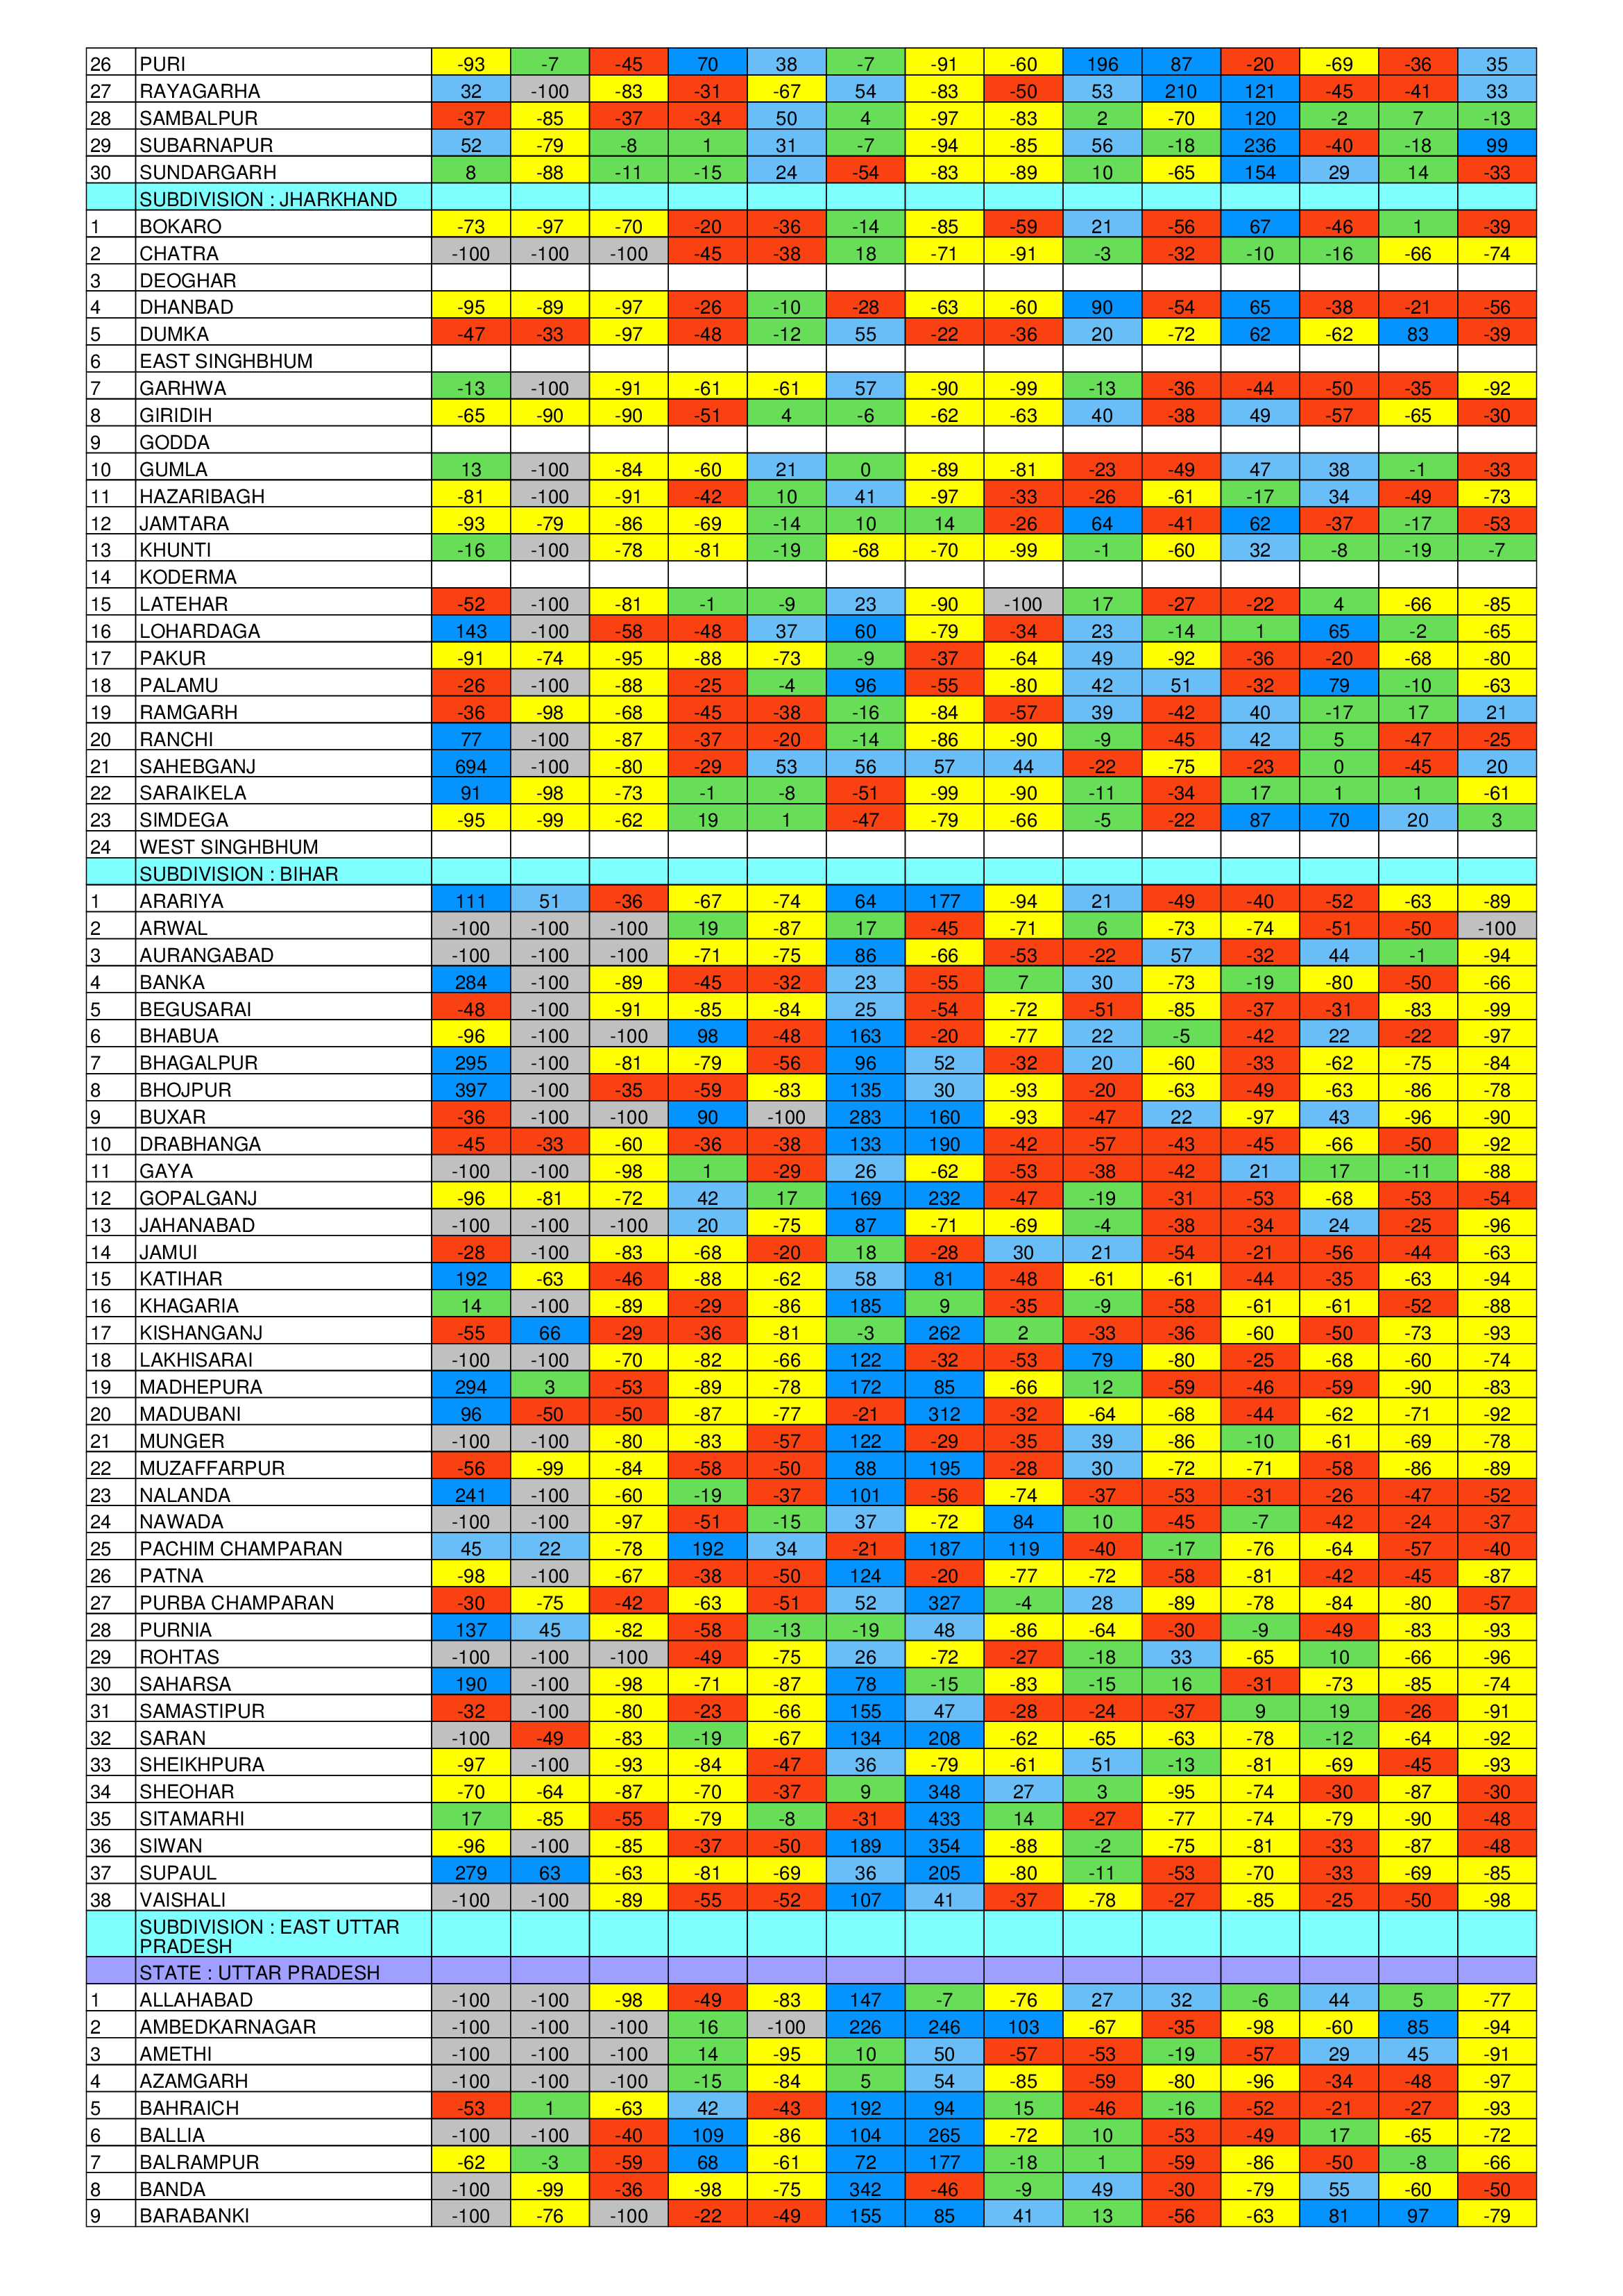
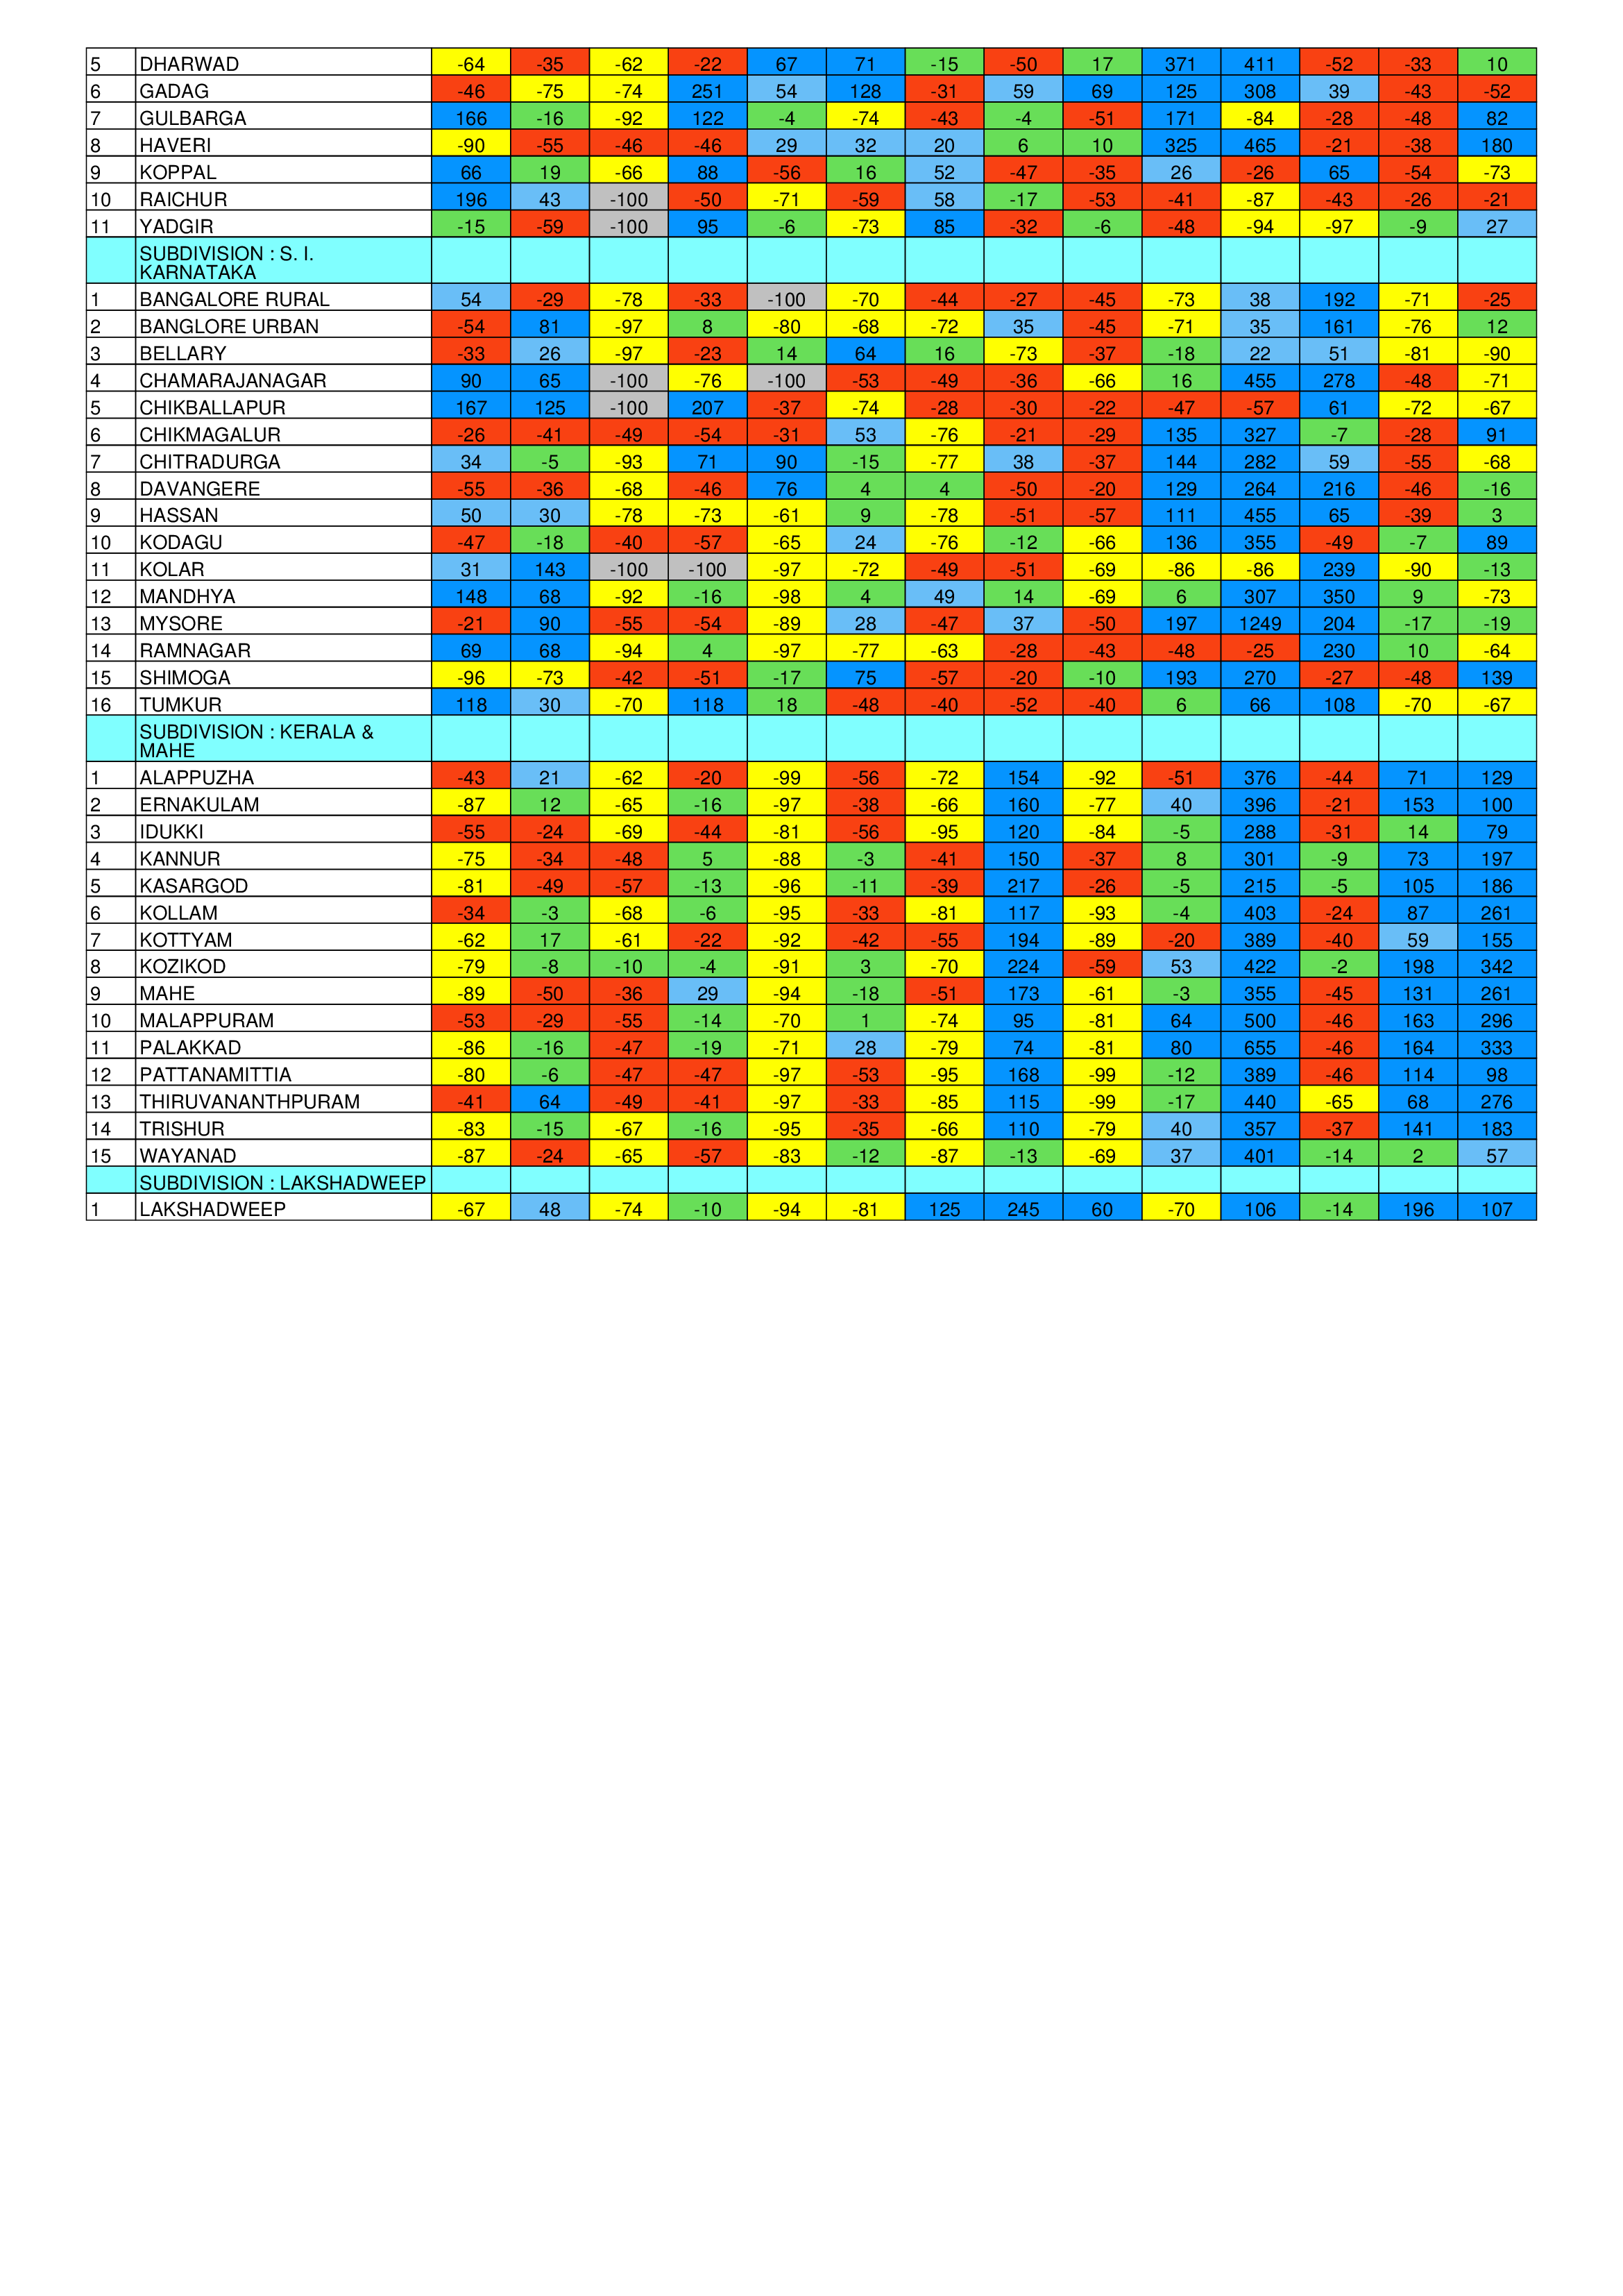
Weekly data from India Meteorological Department is available here.

Cookies Settings

Dialogue Earth uses cookies to provide you with the best user experience possible. Cookie information is stored in your browser. It allows us to recognise you when you return to Dialogue Earth and helps us to understand which sections of the website you find useful.

Required Cookies

Required Cookies should be enabled at all times so that we can save your preferences for cookie settings.

Dialogue Earth - Dialogue Earth is an independent organisation dedicated to promoting a common understanding of the world's urgent environmental challenges. Read our privacy policy.

Cloudflare - Cloudflare is a service used for the purposes of increasing the security and performance of web sites and services. Read Cloudflare's privacy policy and terms of service.

Functional Cookies

Dialogue Earth uses several functional cookies to collect anonymous information such as the number of site visitors and the most popular pages. Keeping these cookies enabled helps us to improve our website.

Google Analytics - The Google Analytics cookies are used to gather anonymous information about how you use our websites. We use this information to improve our sites and report on the reach of our content. Read Google's privacy policy and terms of service.

Advertising Cookies

This website uses the following additional cookies:

Google Inc. - Google operates Google Ads, Display & Video 360, and Google Ad Manager. These services allow advertisers to plan, execute and analyze marketing programs with greater ease and efficiency, while enabling publishers to maximize their returns from online advertising. Note that you may see cookies placed by Google for advertising, including the opt out cookie, under the Google.com or DoubleClick.net domains.

Twitter - Twitter is a real-time information network that connects you to the latest stories, ideas, opinions and news about what you find interesting. Simply find the accounts you find compelling and follow the conversations.

Facebook Inc. - Facebook is an online social networking service. China Dialogue aims to help guide our readers to content that they are interested in, so they can continue to read more of what they enjoy. If you are a social media user, then we are able to do this through a pixel provided by Facebook, which allows Facebook to place cookies on your web browser. For example, when a Facebook user returns to Facebook from our site, Facebook can identify them as part of a group of China Dialogue readers, and deliver them marketing messages from us, i.e. more of our content on biodiversity. Data that can be obtained through this is limited to the URL of the pages that have been visited and the limited information a browser might pass on, such as its IP address. In addition to the cookie controls that we mentioned above, if you are a Facebook user you can opt out by following this link.

Linkedin - LinkedIn is a business- and employment-oriented social networking service that operates via websites and mobile apps.